We scaled Gartner's $12.9M enterprise benchmark across 8.36 million U.S. businesses. The national total: $617 billion annually.
Click to jump to a section:
Dirty data is any information that is inaccurate, incomplete, inconsistent, duplicated, or outdated within a business system. It's seemingly small, common occurrences within organizations, like:
Dirty data isn't a single problem with a single cause. It accumulates over time through manual data entry errors, poor system integrations, inconsistent formatting standards, and the gradual sprawl of data across disconnected tools and platforms. Every new system added to a business stack is a new opportunity for data to fragment and degrade.
The immediate effects are visible: teams spend hours reconciling conflicting reports, decisions get made on inaccurate information, and customers experience friction when their details are wrong. But the real cost is harder to see. It accumulates in the background as wasted time, missed opportunities, eroded trust in internal systems, and decisions made on a foundation that looks solid but isn't.
Gartner (global technology research and advisory firm) surveyed large enterprise customers regarding poor data quality and found poor data quality costs an average of $12.9 million per year. That figure comes from large enterprises sophisticated enough to have already quantified the problem, but for most businesses, the cost is proportionally smaller, but the underlying damage is the same: operational drag, compounding inefficiency, and a growing gap between the data a business has and the data it needs.
Read more on the problem with Gartner's original figure, which led to this research.
With AI, whatever it's fed gets amplified. Clean, connected data produces genuine insight. The fragmented, duplicated mess most organizations actually have produces confident-sounding nonsense at machine speed, with no human in the loop to catch it.
This is why 42% of companies scrapped most of their AI initiatives in 2025, up from 17% the year before. AI investment increasing amplifies bad data's impact - and cost.
Organizations deploying AI without the underlying information architecture (clean, structured, connected data) fail to deliver on its value and accelerate their existing problems at machine speed.
Gartner tried to quantify this back in 2020. Their answer: $12.9 million per year, on average. This figure gets cited constantly and for the Fortune 500, but it's meaningless for most businesses. A 50-person company doesn't lose $12.9 million to bad data - most don't even have $12.9 million in revenue.
We set out to build upon this data point by answering a different question: what does dirty data actually cost across the entire economy? Not just the Fortune 500's, but every business in every state across industries, from two-person operations to mid-market companies and everything in between.
Our goal was to produce a figure that businesses could actually use. One grounded in representative data, scaled by real-world employment patterns, and broken down to the level where it becomes truly actionable: by industry, by state, by county.
We scaled Gartner's baseline using the US Census Bureau County Business Patterns data, covering 8.36 million establishments and 139.8 million employees, and weighted by industry-specific IT spending intensity.
Add it all up across 139.8 million workers in 8.36 million businesses, and the number is $617 billion. That is the annual cost of dirty data to the American economy.
To put it in context: it represents roughly 2% of US GDP. It is more than the entire federal education budget. It is enough to fund NASA more than twenty times over.
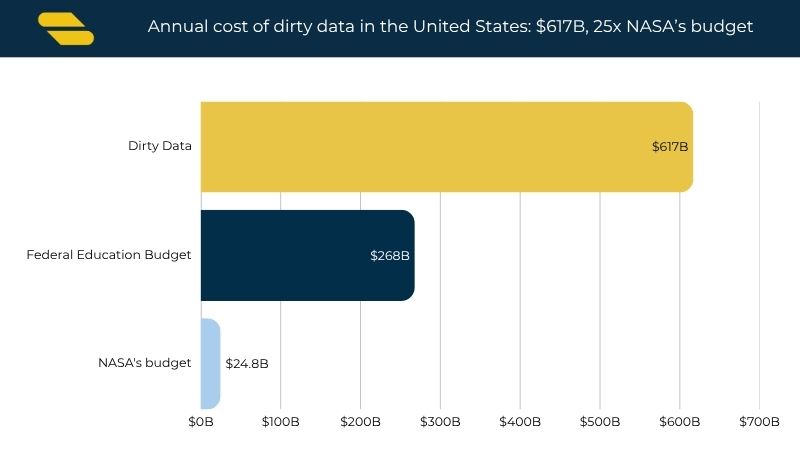
The $617 billion figure is a snapshot of a problem that is actively getting worse because of bad data architecture, governance, and failing to address friction that seeps into business processes.
According to International Data Corporation (IDC), the volume of data stored globally doubles approximately every four years. More data means more dirty data. More dirty data means higher costs.
At current data growth rates, annual dirty data costs will double every four years. Measured against projected US GDP growth of 4% annually, that trajectory looks like this:
For context, the entire US healthcare industry currently accounts for around 17% of GDP. On the current trajectory, the cost of dirty data alone could approach half that figure within 12 years.
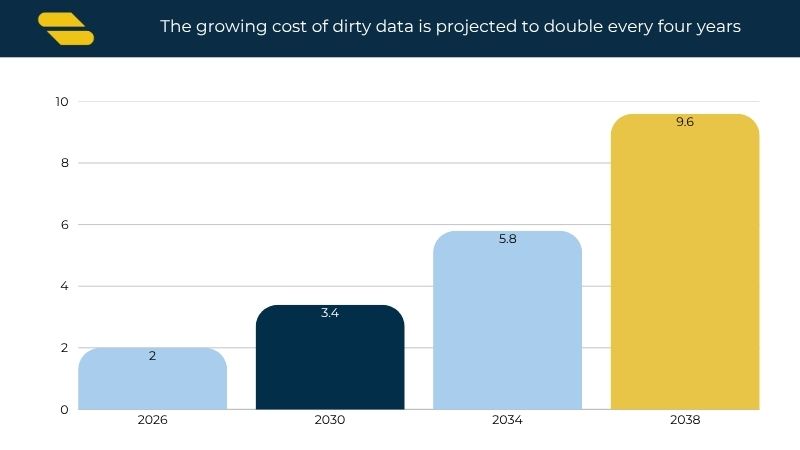
These are not worst-case projections. They assume only that the data volume continues to grow at its current rate. If AI adoption accelerates the creation and complexity of data, as most forecasts suggest it will, the real number could be higher.
The Gartner benchmark was built on companies with an average of 2,626 employees. Dividing the $12.9 million figure by the employee count yields a baseline cost of $4,912 per employee per year.
That per-employee rate is then applied proportionally across each business-size tier in the Census data.
| Employee Range | Total Businesses | Total Employees | Employees Per Business | Cost Per Business |
|---|---|---|---|---|
| 1-4 employees | 4,639,650 | 7,575,276 | 2 | $8,020.53 |
| 5-9 employees | 1,465,355 | 9,721,925 | 7 | $32,591.13 |
| 10-19 employees | 1,047,307 | 14,195,837 | 14 | $66,585.10 |
| 20-49 employees | 759,342 | 22,828,921 | 30 | $147,685.55 |
| 50-99 employees | 249,344 | 17,109,742 | 69 | $337,081.23 |
| 100-249 employees | 138,356 | 20,808,223 | 150 | $738,800.23 |
| 250-499 employees | 38,279 | 13,041,850 | 341 | $1,673,665.43 |
| 500-999 employees | 14,239 | 9,681,464 | 680 | $3,340,039.28 |
| 1000+ employees | 9,470 | 24,868,504 | 2,626 | $12,900,000.00 |
| All sizes | 8,361,342 | 139,831,742 | 17 | $82,152.32 |
| Per Employee | $4,912.36 |
The smallest businesses, those with 1-4 employees, are not losing $12.9 million - but they are losing a proportional share of it, scaled to their footprint.
The pattern holds at every size: dirty data creates drag, and drag compounds.
| Sector | Hidden Cost of Dirty Data | Cost Per Employee |
|---|---|---|
| Information | $46,322,278,577 | $12,161 |
| Finance & Insurance | $41,884,581,345 | $5,991 |
| Accommodation & Food Services | $71,760,563,953 | $4,912 |
| Administrative & Support Services | $66,095,101,921 | $4,912 |
| Construction | $37,626,006,366 | $4,912 |
| Wholesale Trade | $30,635,219,561 | $4,912 |
| Other Services | $27,590,230,459 | $4,912 |
| Educational Services | $19,289,946,499 | $4,912 |
| Management of Companies | $18,940,677,829 | $4,912 |
| Arts, Entertainment, Recreation | $12,238,688,564 | $4,912 |
| Real Estate | $11,749,800,849 | $4,912 |
| Utilities | $3,277,903,655 | $4,912 |
| Mining, Quarrying, Oil & Gas | $2,716,706,027 | $4,912 |
| Agriculture, Forestry, Fishing, Hunting | $792,486,190 | $4,912 |
| Unclassified | $64,803,830 | $4,912 |
| Professional, Scientific, Technical Services | $41,748,851,330 | $4,014 |
| Retail Trade | $59,599,176,138 | $3,714 |
| Transportation & Warehousing | $20,793,231,872 | $3,175 |
| Healthcare & Social Assistance | $66,086,907,628 | $2,995 |
| Manufacturing | $36,948,224,460 | $2,995 |
Not all data environments are equal. A software company and a restaurant chain might employ the same number of people, but their data complexities are worlds apart. We used Flexera's industry IT spending data to weight each sector by its relative data intensity, using the weighted average IT spend of 8.2% as the baseline.
The results are stark. The Information sector, covering software and technology hosting, loses $12,161 per employee annually, nearly 2.5 times the national average. Finance and Insurance incur $5,991 in losses per employee.
In total dollar terms, the picture shifts. The biggest absolute losses come from sectors with massive workforces: Accommodation and Food Services ($71.8 billion), Administrative and Support Services ($66.1 billion), Healthcare and Social Assistance ($66.1 billion), and Retail Trade ($59.6 billion).
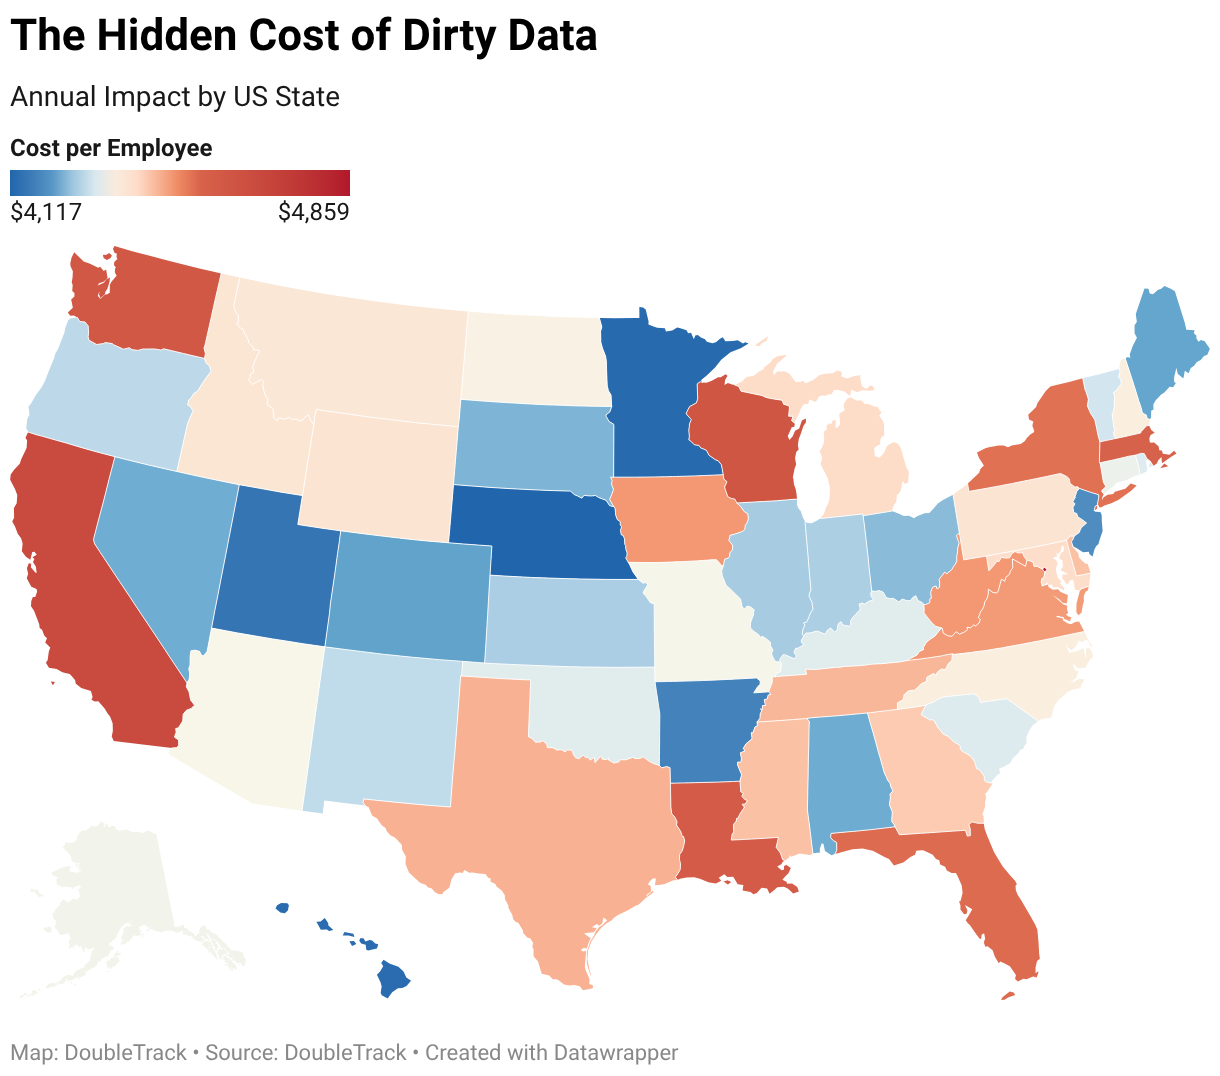
Geography matters because industry mix matters. States with higher concentrations of data-intensive sectors show higher costs per employee. States dominated by agriculture, retail, and hospitality trend lower.
For cost per employee, the District of Columbia leads at $4,859. California follows at $4,658, then Wisconsin ($4,597), Washington ($4,587), and Louisiana ($4,573). At the other end: Nebraska ($4,117), Minnesota ($4,125), Hawaii ($4,131), Utah ($4,151), and Arkansas ($4,178).
The range is tighter than you might expect: just 18% variance between the highest and the lowest. State economies are diverse enough that extremes tend to wash out.
For the total cost, it is a population and economy story. California leads at $76.4 billion. Texas: $53.4 billion. Florida: $45.2 billion. New York: $39.6 billion. Those four states account for over a third of the national total.
State totals reveal which are most exposed. But states' economies vary in diversity. California contains Silicon Valley and the Central Valley. New York contains Manhattan and rural dairy farms. The real variation (and the more actionable data) emerges at the county level.
State-level variance runs 18%. County-level variance runs 114%.
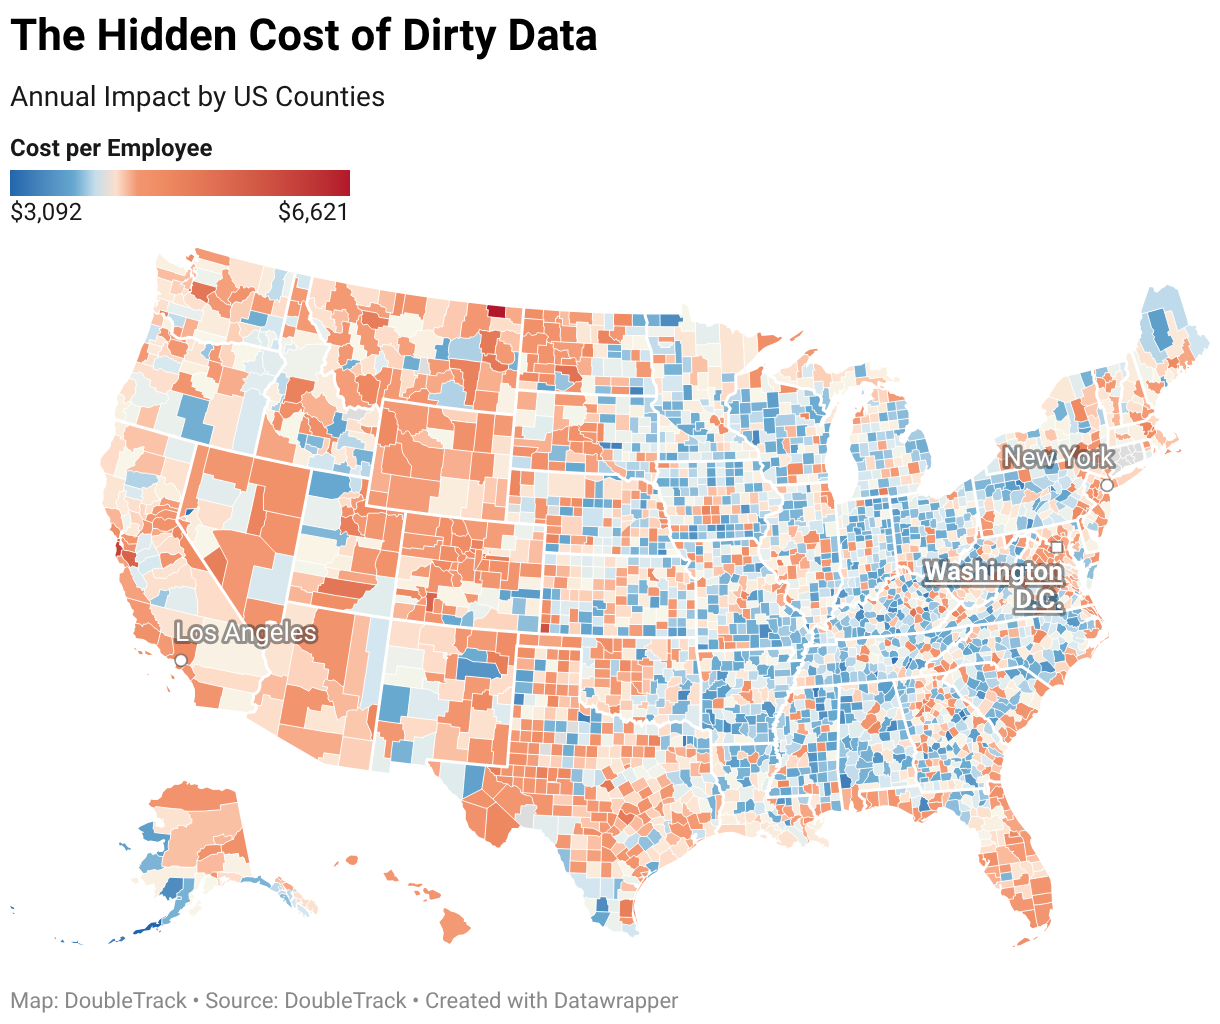
Tech corridor counties dominate the high end. San Mateo County, home to much of Silicon Valley's venture capital and tech headquarters, comes in at $6,085 per employee. But the most expensive county per employee isn't in California. It is Daniels County, Montana, at $6,621, driven by a workforce composition of 30.2% in the Information sector and 7.4% in Finance.
At the other end: rural counties dominated by agriculture, resource extraction, and basic services. Aleutians East Borough, Alaska: $3,092 per employee. Storey County, Nevada: $3,212. Van Buren County, Tennessee: $3,243.
For major metro areas, the numbers are significant in absolute terms. New York County (Manhattan) and Los Angeles County lose $12.4 billion and $18.6 billion, respectively, more than the GDP of some countries.
DoubleTrack's analysis of 8.36 million US businesses and 139.8 million employees estimates the total annual cost of poor data quality to the American economy at $617 billion, approximately 2% of US GDP.
Gartner found that poor data quality costs organizations an average of $12.9 million per year, based on a 2020 survey of 154 large enterprise customers across 16 data quality vendors.
Data-intensive industries lose the most per employee. The Information sector loses an estimated $12,161 per employee annually, nearly 2.5 times the national average. Finance and Insurance incur $5,991 in losses per employee.
In total dollar terms, the biggest losses come from sectors with large workforces: Accommodation and Food Services, Administrative Services, Healthcare, and Retail.
AI amplifies everything, including bad data. Organizations that feed fragmented, inconsistent data into AI systems without AI readiness don't just maintain their existing problems, but accelerate them at machine speed.
This is why 42% of companies scrapped most of their AI initiatives in 2025, up from 17% the year before. The data foundation wasn't there to support the technology.
The clearest signs are operational, not technical.
If your teams regularly reconcile conflicting reports, if sales and finance can't agree on the same number, if onboarding new systems requires months of data cleanup first, you have a dirty data problem. Other indicators: high rates of manual data correction, customer records with missing or duplicate fields, and AI or analytics tools producing outputs your team doesn't trust.
Most organizations with dirty data know something is wrong. They just haven't connected it to the data foundation yet.
It starts with visibility. You need to understand where your data lives, how it moves between systems, and where it breaks down.
From there, the work is architectural: establishing clear data ownership, standardizing how data is captured and structured, and building governance processes that prevent new problems from accumulating. For organizations pursuing AI, this isn't optional - it's the work that needs doing before a single system is built.
DoubleTrack's data architecture consulting helps organizations map their current state and build a foundation that's ready for what comes next.
The $12.9 million annual cost of poor data quality comes from Gartner's Magic Quadrant for Data Quality Solutions (July 27, 2020, authors Melody Chien and Ankush Jain). Gartner surveyed 154 reference customers across 16 data quality vendors and asked them to estimate what poor data quality costs their organization.
These were large enterprises sophisticated enough to already be purchasing data quality software, companies that had done the work to understand and quantify the problem.
U.S. Census Bureau County Business Patterns data (2023 release) shows businesses with 1,000+ employees average 2,626 employees per establishment. This aligns with Gartner's survey population.
Dividing $12.9 million by 2,626 employees yields a baseline cost of $4,912 per employee per year. This per-employee figure was applied across all 139.8 million employees in the Census dataset.
Different industries have different data intensities. We used Flexera's 2020 State of Tech Spend Report, which surveys CIOs on IT spending as a percentage of revenue, to create industry-specific multipliers.
The weighted average IT spend across all industries is 8.2%. Industries spending more than this average have higher data complexity and greater exposure to data quality costs; industries spending less have lower exposure.
Multipliers were calculated by dividing each industry's IT spend percentage by the 8.2% weighted average.
For example: Software companies spend 24.7% of revenue on IT, yielding a multiplier of 3.01x. We averaged Software (3.01x) and Technology Hosting (1.94x) to produce a combined Information sector multiplier of 2.48x. Financial Services at 10% IT spend yields a 1.22x multiplier. Healthcare at 5% yields 0.61x. Retail at 6.2% yields 0.76x.
For industries not covered by Flexera's survey (Construction, Wholesale Trade, Educational Services, Arts and Entertainment, Real Estate, Utilities, Mining, Agriculture, and Administrative Support), we applied a 1.00x multiplier, equivalent to the weighted average IT spend.
State and county totals were calculated by applying the per-employee cost ($4,912) and industry multipliers to employment data from County Business Patterns.
For each geographic unit, we calculated: (Employees in Industry A × $4,912 × Industry A Multiplier) + (Employees in Industry B × $4,912 × Industry B Multiplier) for all industries present in that geography.
Cost per employee figures for states and counties reflect their industry mix. A county with high Information sector concentration will show a higher cost per employee than one dominated by hospitality, even though both use the same underlying methodology.
The Gartner baseline comes from large enterprises already investing in data quality solutions, organisations that have quantified the problem. Smaller businesses may experience different cost profiles.
The industry multipliers assume IT spending intensity correlates with data quality cost exposure, this is a reasonable but unverified assumption.
Industries without Flexera coverage are assigned the weighted average multiplier, which may understate or overstate their actual exposure. All figures represent estimates intended to illustrate the scale of the problem, not precise measurements of actual costs.

Architecture. Before activation.